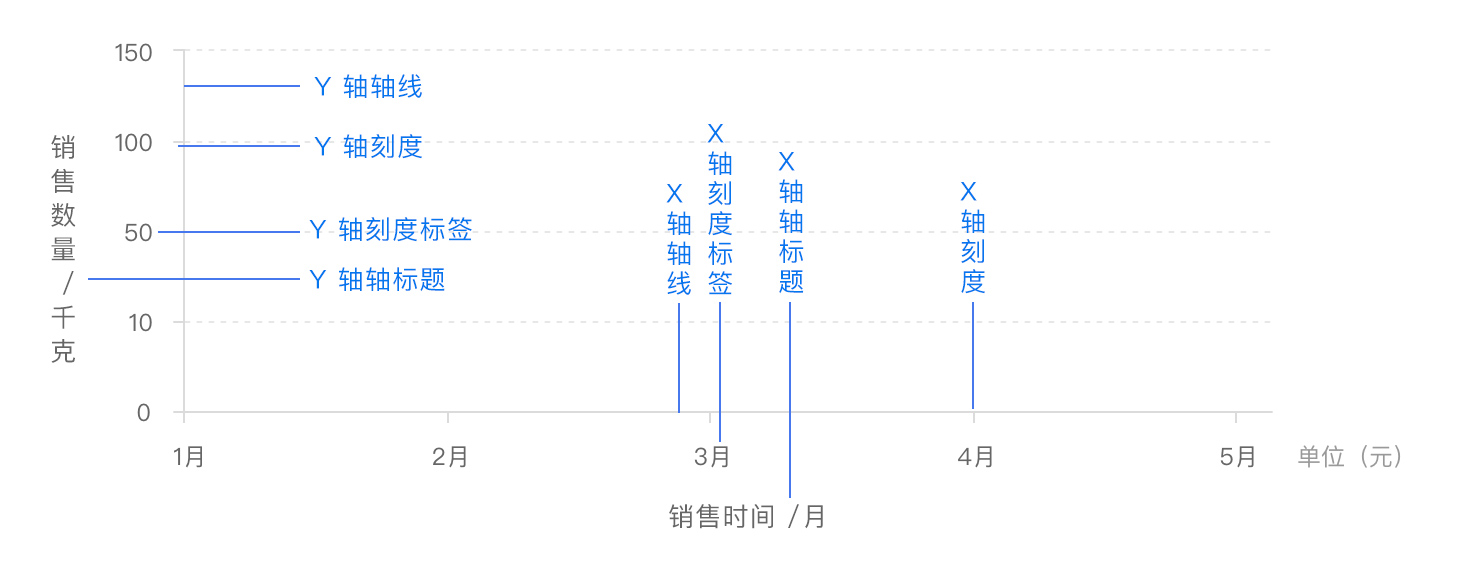
xAxis
ts
xAxis: {
  type: 'category',
  data: timeArray,
  axisLabel: { color: placeholderColor },
  axisLine: {
    lineStyle: {
      color: getChartListColor()[1],
      width: 1,
    },
  },
},
type
坐标轴类型。
category:类目轴,data 必须是离散的类目数组(字符串或数值),适合柱状图/折线图按类目分组显示。
value:数值轴,适合连续数值(Y轴常用)。
time:时间轴,ECharts 会对时间自动做刻度/格式化,data 可以是时间字符串/时间戳/Date。
name
坐标轴名称。类似于标题
nameLocation
坐标轴名称name显示位置。
默认:end,默认位置容易被遮挡,可以更改显示的位置
可选:
'start''middle'或者'center''end'
可选:
'start''middle'或者'center''end'
data
类目数据.Array
警告
data仅在type=category时生效
如果设置了 type 是 'category',但没有设置 axis.data,则 axis.data 的内容会自动从 series.data 中获取,这会比较方便。
ts
// 所有类目名称列表
data: ['周一', '周二', '周三', '周四', '周五', '周六', '周日']
// 每一项也可以是具体的配置项,此时取配置项中的 `value` 为类目名
data: [{
    value: '周一',
    // 突出周一
    textStyle: {
        fontSize: 20,
        color: 'red'
    }
}, '周二', '周三', '周四', '周五', '周六', '周日']
axisLabel
坐标轴刻度标签的相关设置。
formatter
刻度标签的内容格式器,支持字符串模板和回调函数两种形式。
ts
// 使用字符串模板,模板变量为刻度默认标签 {value}
formatter: '{value} kg'
// 使用函数模板,函数参数分别为刻度数值(类目),刻度的索引
formatter: function (value, index, extra?) {
    return value + 'kg';
}
axisLine
坐标轴线
lineStyle
ts
      axisLine: {
        lineStyle: {
          color: 'black',
          width: 1,
        },
      },
splitLine
坐标轴在 grid 区域中的分隔线。
lineStyle
分隔线样式
ts
      splitLine: {
        lineStyle: {
          color: borderColor,
        },
      },
axisTick
坐标刻度
position
x 轴的位置。
可选:
'top''bottom'
min
坐标轴刻度最小值。
不设置时会自动计算最小值保证坐标轴刻度的均匀分布。
① number(数值轴 value / log)
直接指定最小刻度,如:
xAxis: { min: 0 }② string(类目轴 category)
可以写:
- 类目名称,例如
'苹果' - 类目序号(从 0 开始),也支持负数(从末尾倒数计数)
xAxis: { min: '星期三' }
xAxis: { min: 2 } // 第三个类目
xAxis: { min: -1 } // 最后一个类目
③ 时间类型(time)
支持:
- 字符串
'2024-04-09 13:00:00' - 时间戳
1712667600000 - JS Date 对象
new Date(...)
dataMin
此时取数据在该轴上的最小值作为最小刻度
max
用法同min
minInterval
最小间隔,例如y轴的值只可能是整数:
ts
yAxis: {
  type: 'value',
  minInterval: 1
}
Example
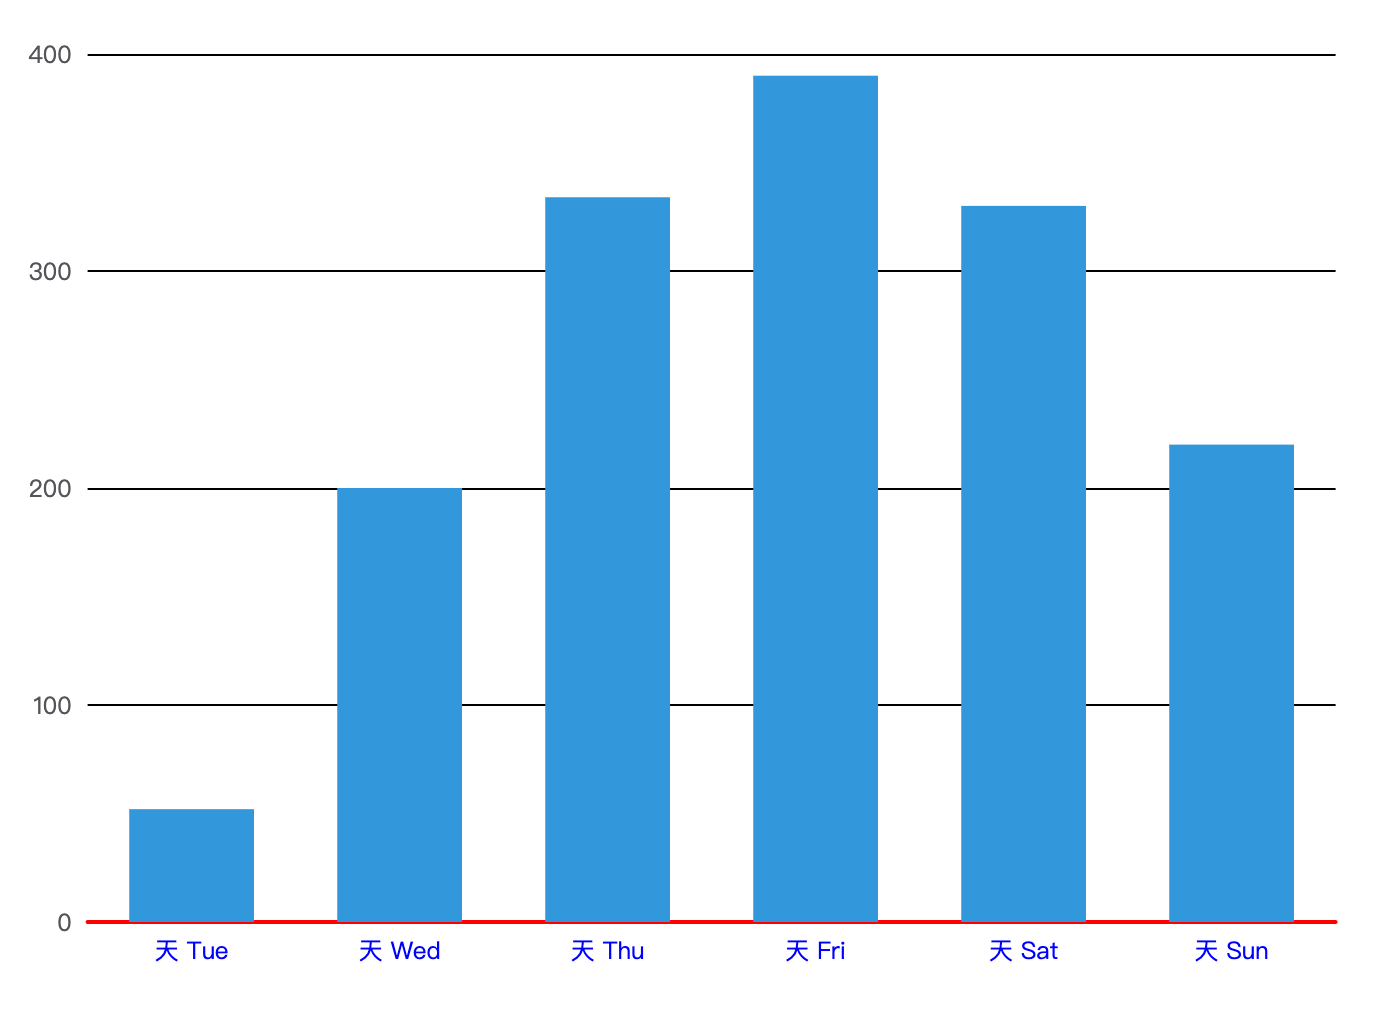
ts
option = {
  color: ['#3398DB'],
  tooltip: {
    trigger: 'axis',
    axisPointer: {
      type: 'shadow'
    }
  },
  grid: {},
  xAxis: [
    {
      type: 'category',
      min:1,
      name:'星期',
      nameLocation:'middle',
      axisLabel: {
        color: 'blue',
        formatter: '天 {value}'
      },
      axisLine: {
        lineStyle: {
          color: 'red',
          width: 2
        }
      },
      data: ['Mon', 'Tue', 'Wed', 'Thu', 'Fri', 'Sat', 'Sun']
    }
  ],
  yAxis: [
    {
      type: 'value',
      name:'数量',
      nameLocation:'middle',
      splitLine:{
        lineStyle:{
          color:'black'
        }
      }
    }
  ],
  series: [
    {
      name: '直接访问',
      type: 'bar',
      barWidth: '60%',
      data: [10, 52, 200, 334, 390, 330, 220]
    }
  ]
};